plots a flextable as a grid grob object and display the result in a new graphics window. 'ragg' or 'svglite' or 'ggiraph' graphical device drivers should be used to ensure a correct rendering.
Usage
# S3 method for class 'flextable'
plot(x, ...)
Arguments
- x
a 'flextable' object, see flextable-package to learn how to create 'flextable' object.
- ...
additional arguments passed to
gen_grob().
caption
It's important to note that captions are not part of the table itself. This means when exporting a table to PNG or SVG formats (image formats), the caption won't be included. Captions are intended for document outputs like Word, HTML, or PDF, where tables are embedded within the document itself.
See also
Other functions for flextable output and export:
df_printer(),
flextable_to_rmd(),
gen_grob(),
htmltools_value(),
knit_print.flextable(),
print.flextable(),
repair_docx(),
save_as_docx(),
save_as_html(),
save_as_image(),
save_as_pptx(),
save_as_rtf(),
to_html.flextable(),
wrap_flextable()
Examples
library(gdtools)
library(ragg)
register_liberationsans()
#> [1] TRUE
set_flextable_defaults(font.family = "Liberation Sans")
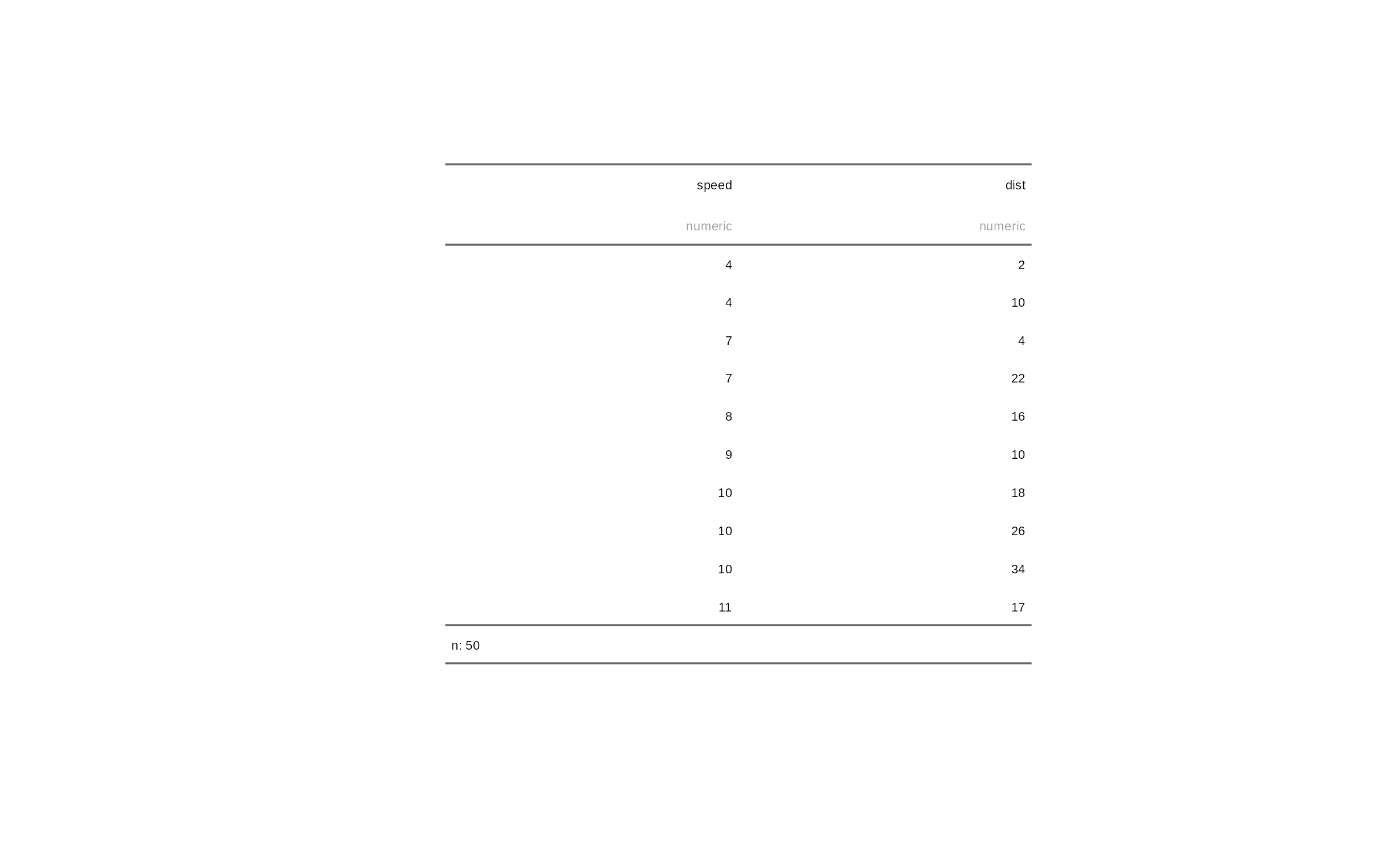
ftab <- as_flextable(cars)
plot(ftab)