gen_grob() converts a flextable into a Grid Graphics
object (grob) that can be drawn on any R graphic device.
This is the function behind save_as_image() and the
patchwork integration (wrap_flextable()).
Typical uses:
embed a flextable in a
ggplot2plot (viawrap_flextable()or cowplot)export a flextable as a PNG or SVG image (via
save_as_image())
Text wrapping and scaling are supported. The fit
argument controls how the table adapts to the available
space (fixed size, auto-fit width, or fill the device).
Not recommended for very large tables because the grid calculations can be slow.
Limitations: equations (as_equation()) and hyperlinks
(officer::hyperlink_ftext()) are not rendered.
Use a 'ragg', 'svglite' or 'ggiraph' device for correct rendering.
Arguments
- x
a 'flextable' object, see flextable-package to learn how to create 'flextable' object.
- ...
Reserved for extra arguments
- fit
Determines the fitting/scaling of the grob on its parent viewport. One of
auto,width,fixed,TRUE,FALSE:autoorTRUE(default): The grob is resized to fit in the parent viewport. The table row heights and column widths are resized proportionally.width: The grob is resized horizontally to fit the width of the parent viewport. The column widths are resized proportionally. The row heights are unaffected and the table height may be smaller or larger than the height of the parent viewport.fixedorFALSE: The grob will have fixed dimensions, as determined by the column widths and the row heights.
- scaling
Determines the scaling of the table contents. One of
min,full,fixed,TRUE,FALSE:minorTRUE(default): When the parent viewport is smaller than the necessary, the various content sizes (text font size, line width and image dimensions) will decrease accordingly so that the content can still fit. When the parent viewport is larger than the necessary, the content sizes will remain the same, they will not increase.full: Same asmin, except that the content sizes are scaled fully, they will increase or decrease, according to the size of the drawing surface.fixedorFALSE: The content sizes will not be scaled.
- wrapping
Determines the soft wrapping (line breaking) method for the table cell contents. One of
TRUE,FALSE:TRUE: Text content may wrap into separate lines at normal word break points (such as a space or tab character between two words) or at newline characters anywhere in the text content. If a word does not fit in the available cell width, then the text content may wrap at any character. Non-text content (such as images) is also wrapped into new lines, according to the available cell width.FALSE: Text content may wrap only with a newline character. Non-text content is not wrapped.
Superscript and subscript chunks do not wrap. Newline and tab characters are removed from these chunk types.
- autowidths
If
TRUE(default) the column widths are adjusted in order to fit the contents of the cells (taking into account thewrappingsetting).- just
Justification of viewport layout, same as
justargument ingrid::grid.layout(). When set toNULL(default), it is determined according to thefitargument.
size
The size of the flextable can be known by using the method dim on the grob.
caption
It's important to note that captions are not part of the table itself. This means when exporting a table to PNG or SVG formats (image formats), the caption won't be included. Captions are intended for document outputs like Word, HTML, or PDF, where tables are embedded within the document itself.
See also
Other functions for flextable output and export:
df_printer(),
flextable_to_rmd(),
htmltools_value(),
knit_print.flextable(),
plot.flextable(),
print.flextable(),
repair_docx(),
save_as_docx(),
save_as_html(),
save_as_image(),
save_as_pptx(),
save_as_rtf(),
to_html.flextable(),
wrap_flextable()
Examples
library(ragg)
library(gdtools)
register_liberationsans()
#> [1] TRUE
set_flextable_defaults(font.family = "Liberation Sans")
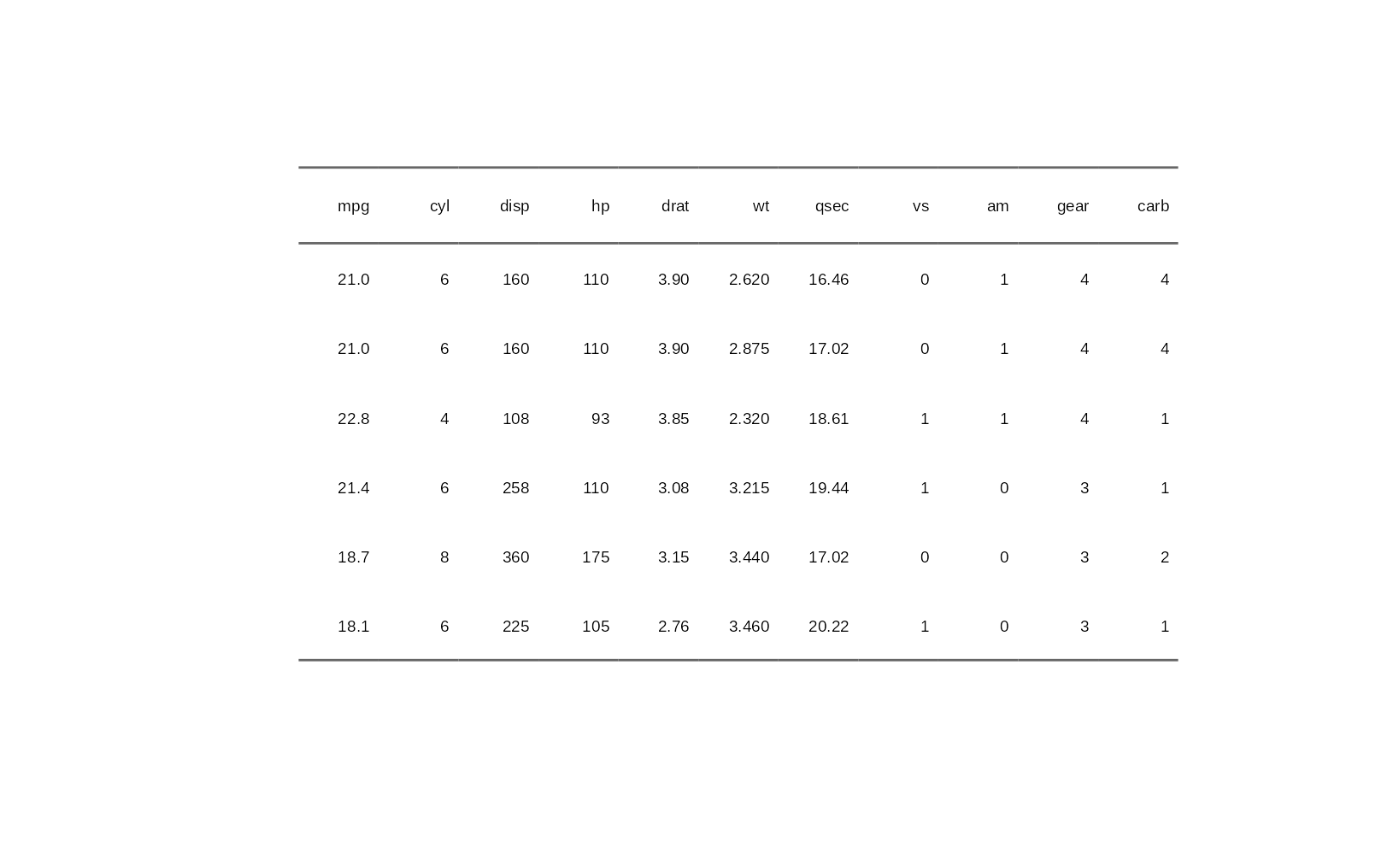
ft <- flextable(head(mtcars))
gr <- gen_grob(ft)
plot(gr)